
Buying a home is a big deal for any Australian, and it’s good to know what is happening in the home loan market.
This information can surely help you make decisions when you are buying a home.
From how people are borrowing to what is happening with interest rates, home loan statistics give us a pattern of how Australians are borrowing money in 2026.
If you’re buying a home for the first time, want a bigger home loan, or change your current home loan, these statistics can help you.
At Loancalculator.com.au, we have gathered home loan statistics from the sources we trust, like the Australian Bureau of Statistics, the Reserve Bank of Australia and the Australian Prudential Regulation Authority to help you understand the home loan market.
Home Loan Statistics at a Glance
These are some of the key home loan statistics shaping Australia’s property market in 2026:
- According to the Australian Bureau of Statistics (ABS), the average new owner-occupier home loan in Australia was $735,000 in the March Quarter 2026.
- Tasmania and the Northern Territory recorded the lowest average new owner-occupier loan sizes in March 2026, at $521,000 and $536,000 respectively.
- According to the ABS, there were 57,342 new investor loan commitments recorded in the March Quarter 2026.
- ABS data shows refinancing remained active in the March Quarter 2026, with 66,617 external owner-occupier refinancing commitments recorded during the quarter.
- According to the Reserve Bank of Australia (RBA), changes in the cash rate influence mortgage interest rates across Australia.
These figures show how Australia’s lending market continues to evolve as property prices, borrowing costs and buyer demand change across the country.
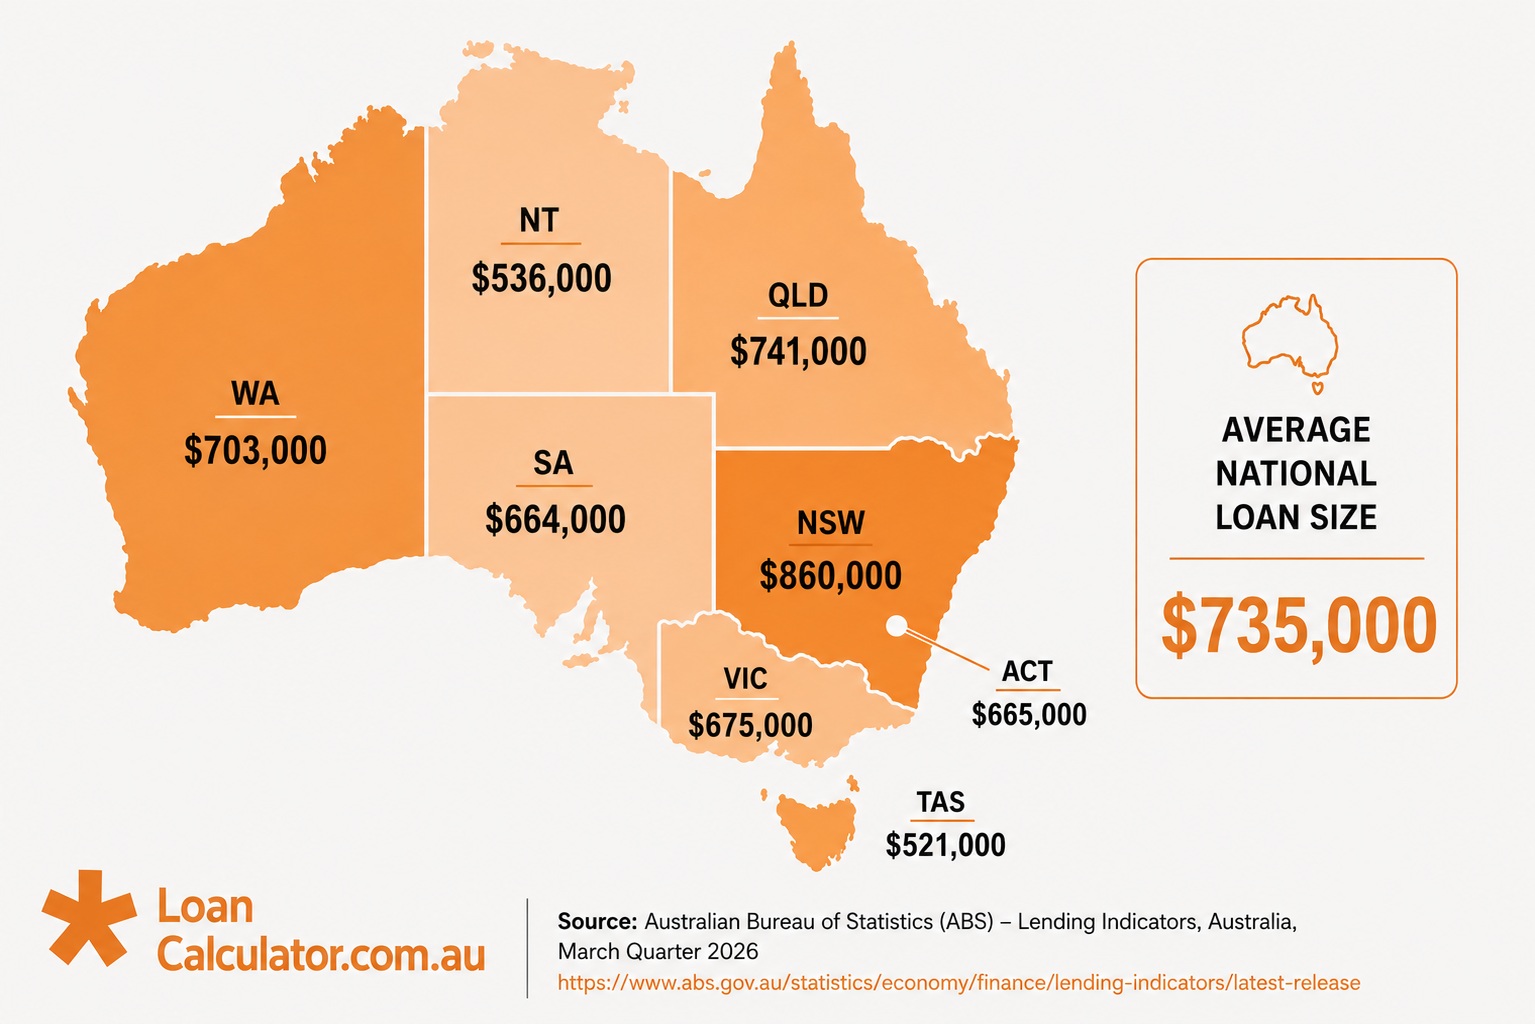
Average Home Loan Size by State
According to the ABS, the average home loan sizes are different in parts of Australia because the prices of properties are very different from one state to another.
| State / Territory | Average Home Loan (AUD) |
| Australia | $735,000 |
| New South Wales | $860,000 |
| Victoria | $675,000 |
| Queensland | $741,000 |
| South Australia | $664,000 |
| Western Australia | $703,000 |
| Tasmania | $521,000 |
| Northern Territory | $536,000 |
| ACT | $665,000 |
Source: Australian Bureau of Statistics (ABS) – Lending Indicators.
The latest ABS figures highlight the differences between Australia’s property markets. Buyers in New South Wales typically need to borrow the most due to higher property prices, particularly in Sydney. In comparison, borrowers in Tasmania and the Northern Territory generally require smaller home loans, reflecting more affordable property markets.
Interest rates also continue to influence borrowing decisions. According to the Reserve Bank of Australia (RBA), changes to the official cash rate continue to affect mortgage interest rates across Australia. Even a small change in your interest rate can impact your monthly repayments and the total amount repaid over the life of your loan.
The ABS data also shows that people who are buying a home for the first time are still very important to Australia’s housing market. The government is helping these first-home buyers with programs. These programs are from the state government and the federal government. They want to make it easier for people to own a home.

“The latest ABS data recorded 30,241 first-home buyer loan commitments in the March quarter of 2026. If you’re preparing to buy your first home, use figures like these as context, but focus on what you can comfortably afford rather than comparing yourself with the average borrower.”
— Tom Caesar, Managing Editor
What These Statistics Mean for Borrowers?
While national averages give an idea, each person who wants to borrow money has their own situation. Your income, the money you have saved, your credit history, the debts you already have, and what the lender thinks all help decide how much you can borrow and what interest rate you will get.
Learning about what’s happening in the market can help you have realistic ideas before you apply for a home loan. For instance, if the average amount people borrow keeps getting bigger, you might need to save money for a deposit or change how much you plan to borrow depending on where you want to buy a house.
Also, watching what happens with interest rates can help you see how changes in the way loans are given might affect the money you have to pay over time.
At LoanCalculator.com.au, you can use our free home loan calculator to guess how much you will have to pay back, try loan amounts and interest rates, and look at different loan situations before you move forward.
Learn How the Latest Home Loan Trends Could Affect You!
Why Home Loan Statistics Matter?
Home loan statistics aren’t just useful for economists or industry experts. They can also help everyday Australians make better financial decisions.
By understanding the latest lending data, you can:
- Gain a better understanding of today’s property market.
- Set realistic expectations before applying for a home loan.
- See how average borrowing amounts differ across Australia.
- Understand how interest rates may affect your repayments.
- Plan your budget with greater confidence before speaking with a lender.
While every borrower’s circumstances are different, market statistics provide valuable context that can help you make more informed decisions throughout your home-buying journey.
Final Thoughts
Home loan statistics do more than just show what is happening in Australia’s lending market; they also offer information that can help people understand current trends better.
If you are buying your home, changing an existing mortgage, or looking to invest in property, keeping track of the latest lending statistics can help you prepare for the future with more confidence.
Before you apply for a home loan, it’s a good idea to learn how interest rates, average loan amounts and current market situations can influence your borrowing choices. At LoanCalculator.com.au, we are here to help you make decisions by offering useful home loan guides, simple-to-use calculators and useful comparison tools.